
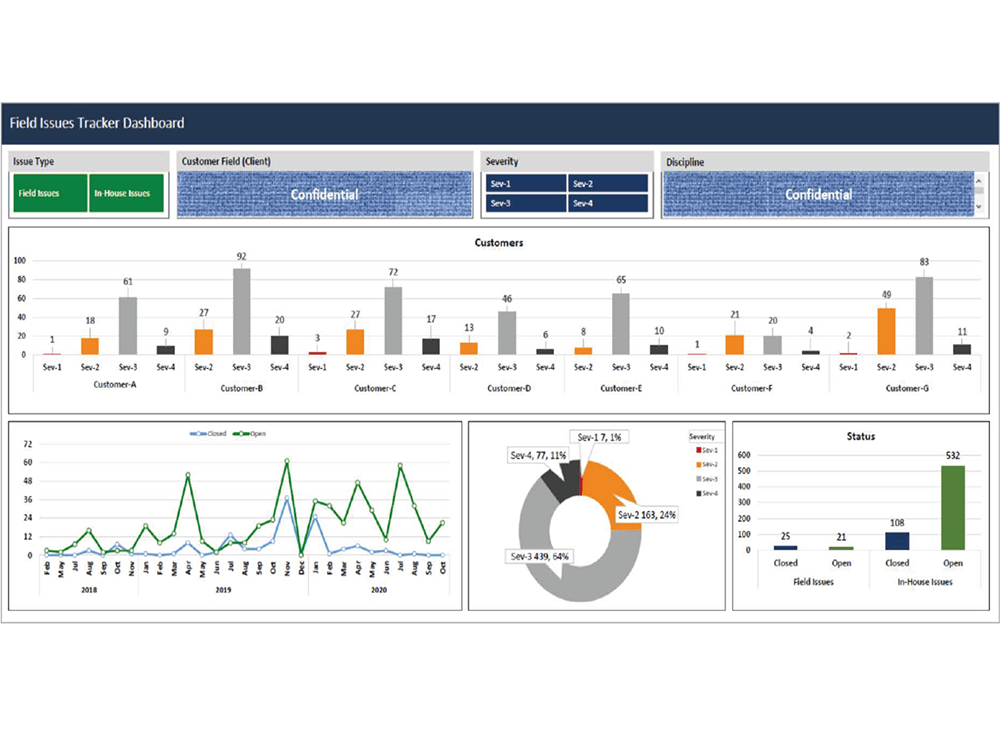


Turn business data into a clear and interactive Microsoft Excel dashboard that makes important metrics easier to monitor, compare, and understand. The dashboard can organize multiple data points into a structured visual interface for reporting and business analysis.
Dashboard Development
- Custom Excel dashboard design
- Interactive charts and data visualizations
- KPI and performance metric tracking
- Data summaries and comparative analysis
- Filters and interactive dashboard elements
- Structured presentation of business data
- User-friendly reporting layout
Business Applications
Dashboards can be designed for different reporting needs, such as:
- Sales performance
- Revenue tracking
- Business operations
- Marketing analysis
- Financial reporting
- Customer data
- Inventory monitoring
- Performance management
- Management reporting
Data Visualization
The dashboard can combine relevant tables, charts, indicators, and summaries to make patterns and key results easier to identify. The layout is structured around the available data and the specific metrics you need to monitor.
Data Tool
- Microsoft Excel
Project Requirements
You can provide an existing Excel dataset, spreadsheet, or structured data source along with the key metrics and reporting requirements. The dashboard will then be organized into a practical format for ongoing analysis and reporting.
Be the first to review “Interactive Excel Business Dashboard Service”
Related products

Development & IT

Development & IT
Custom Database Data Migration and Format Conversion Service

Development & IT
Excel VBA Automation and Custom Dashboard Development Service

Development & IT

Development & IT

Development & IT

Development & IT
Professional WordPress Website Design and Development Service
Development & IT
SQL Query Performance Optimization and Database Consulting Service
Reviews
There are no reviews yet.